
10
Stars
1
Forks
3
Watchers
CSS
Language
53.7
SrcLog Score
Growth over time
4 data points · 2026-07-18 → 2026-09-14
Stars
Forks
Watchers
💬
How do you feel about this project?
Ask AI about CWC-Area-Chart
Question copied to clipboardWhat is the David-PLC/CWC-Area-Chart GitHub project? Description: "Area chart based on Apexcharts.js as custom web control for WinCC Unified". Written in CSS. Explain what it does, its main use cases, key features, and who would benefit from using it.
Question is copied to clipboard — paste it after the AI opens.
🏆 Show off this rank
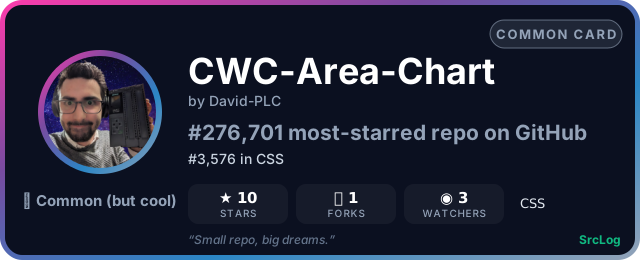


Add it to a GitHub README or profile — the card updates as the ranking changes:
How to clone CWC-Area-Chart
Clone via HTTPS
git clone https://github.com/David-PLC/CWC-Area-Chart.git
Clone via SSH
[email protected]:David-PLC/CWC-Area-Chart.git
Download ZIP
Download main.zipFound an issue?
Report bugs or request features on the CWC-Area-Chart issue tracker:
Open GitHub IssuesSimilar to CWC-Area-Chart
Chart.js
echarts
charts
c3
tui.editor
vis
helm
timesheet.js
webpack-bundle-analyzer
hellocharts-android
visx
peity
react-vis
tui.chart
britecharts
billboard.js
Live-Charts
plottable
AAChartKit
wx-charts
ngx-charts
vue-chartjs
smoothie
go-chart
awesome-dataviz
SwiftCharts
echarts-for-weixin
echarts-for-react
react-native-chart
orange3