
Data-Visualistion
harshagr18
Notebooks, code and data for visualization of data and creating prediction models by extracting useful data. Consists of notebooks from all fields of study including telecom and medical fields.
Growth over time
6 data points · 2021-08-01 → 2023-03-01How do you feel about this project?
Ask AI about Data-Visualistion
Question copied to clipboardWhat is the harshagr18/Data-Visualistion GitHub project? Description: "Notebooks, code and data for visualization of data and creating prediction models by extracting useful data. Consists of notebooks from all fields of study including telecom and medical fields.". Written in Jupyter Notebook. Explain what it does, its main use cases, key features, and who would benefit from using it.
Question is copied to clipboard — paste it after the AI opens.
🏆 Show off this rank
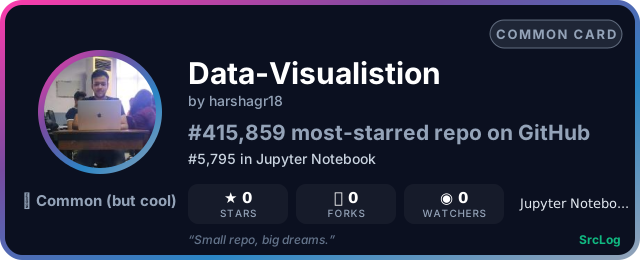


Add it to a GitHub README or profile — the card updates as the ranking changes:
How to clone Data-Visualistion
Clone via HTTPS
Clone via SSH
Download ZIP
Download master.zipFound an issue?
Report bugs or request features on the Data-Visualistion issue tracker:
Open GitHub Issues