
1
Repos
5
Stars
0
Forks
5
Watchers
🏆 Show off this rank
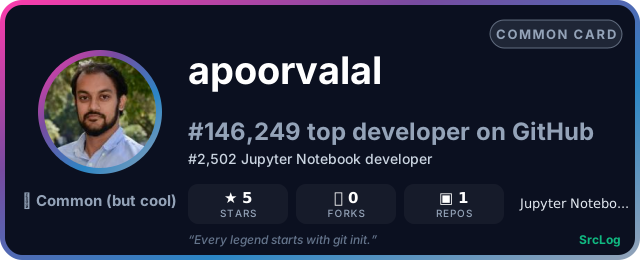


Add it to a GitHub README or profile — the card updates as the ranking changes: