
7
Repos
1.8k
Stars
255
Forks
33
Watchers
🏆 Show off this rank
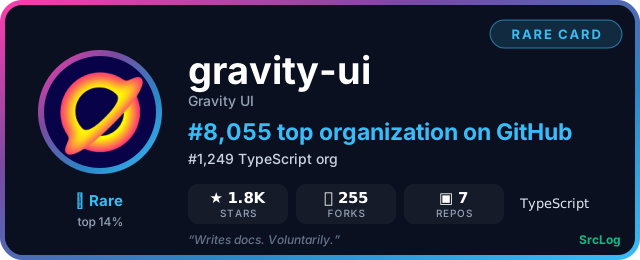
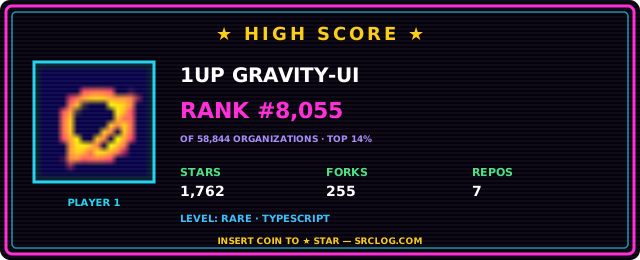

Add it to a GitHub README or profile — the card updates as the ranking changes:
Repositories (7)
uikit
gravity-ui/uikit
TypeScript
1.1k
163
markdown-editor
gravity-ui/markdown-editor
TypeScript
Markdown wysiwyg and markup editor
429
49
icons
gravity-ui/icons
TypeScript
145
14
charts
gravity-ui/charts
TypeScript
Declarative React charting library: line, area, bar, pie, scatter, treemap, sankey, heatmap, and more, rendered from a single data config
42
9
data-source
gravity-ui/data-source
TypeScript
A wrapper around data fetching
30
4
chartkit
gravity-ui/chartkit
TypeScript
Plugin-based React component that renders charts from multiple charting libraries, such as Gravity Charts and Yagr, through a single ChartKit API, with mobile-friendly tooltips and custom plugin support
29
6
date-components
gravity-ui/date-components
TypeScript
18
10