
rx-visualization
fingerpich
Visualizes Reactive Streams with interactive diagrams to make it easy to learn Rxjs.
55
Stars
6
Forks
55
Watchers
TypeScript
Language
100
SrcLog Score
Growth over time
1 data points · 2021-08-07 → 2021-08-07
Stars
Forks
Watchers
💬
How do you feel about this project?
Ask AI about rx-visualization
Question copied to clipboardWhat is the fingerpich/rx-visualization GitHub project? Description: "Visualizes Reactive Streams with interactive diagrams to make it easy to learn Rxjs.". Written in TypeScript. Explain what it does, its main use cases, key features, and who would benefit from using it.
Question is copied to clipboard — paste it after the AI opens.
🏆 Show off this rank
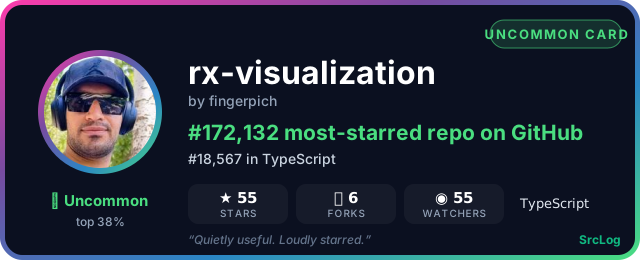


Add it to a GitHub README or profile — the card updates as the ranking changes:
How to clone rx-visualization
Clone via HTTPS
git clone https://github.com/fingerpich/rx-visualization.git
Clone via SSH
[email protected]:fingerpich/rx-visualization.git
Download ZIP
Download master.zipFound an issue?
Report bugs or request features on the rx-visualization issue tracker:
Open GitHub IssuesSimilar to rx-visualization
d3
echarts
metabase
algorithm-visualizer
redash
bokeh
vis
timesheet.js
dc.js
vega
G2
rawgraphs-app
visx
heatmap.js
react-vis
tui.chart
plotly.py
Under-the-hood-ReactJS
vprof
httpstat
graphql-voyager
VivaGraphJS
kepler.gl
scope
flask_jsondash
vizceral
tensorboardX
hygieia
illustrated-algorithms
dygraphs