
plot
observablehq
A concise API for exploratory data visualization implementing a layered grammar of graphics
5.4k
Stars
252
Forks
42
Watchers
HTML
Language
isc
License
100
SrcLog Score
Growth over time
15 data points · 2021-08-01 → 2026-11-01
Stars
Forks
Watchers
💬
How do you feel about this project?
Ask AI about plot
Question copied to clipboardWhat is the observablehq/plot GitHub project? Description: "A concise API for exploratory data visualization implementing a layered grammar of graphics". Written in HTML. Explain what it does, its main use cases, key features, and who would benefit from using it.
Question is copied to clipboard — paste it after the AI opens.
🏆 Show off this rank
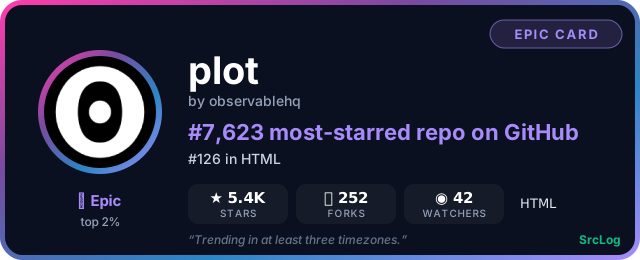


Add it to a GitHub README or profile — the card updates as the ranking changes:
How to clone plot
Clone via HTTPS
git clone https://github.com/observablehq/plot.git
Clone via SSH
[email protected]:observablehq/plot.git
Download ZIP
Download main.zipFound an issue?
Report bugs or request features on the plot issue tracker:
Open GitHub IssuesSimilar to plot
freeCodeCamp
freecodecamp.cn
learn-anything
recharts
plotly.js
c3
rickshaw
victory
vega
visx
plotly.py
britecharts
vprof
billboard.js
mozaik
flask_jsondash
d3-cloud
plottable
ngx-charts
spritejs
calendar-heatmap
iD
react-d3-components
planetary.js
just-dashboard
markvis
react-faux-dom
victory-native
d3-tip
resonance